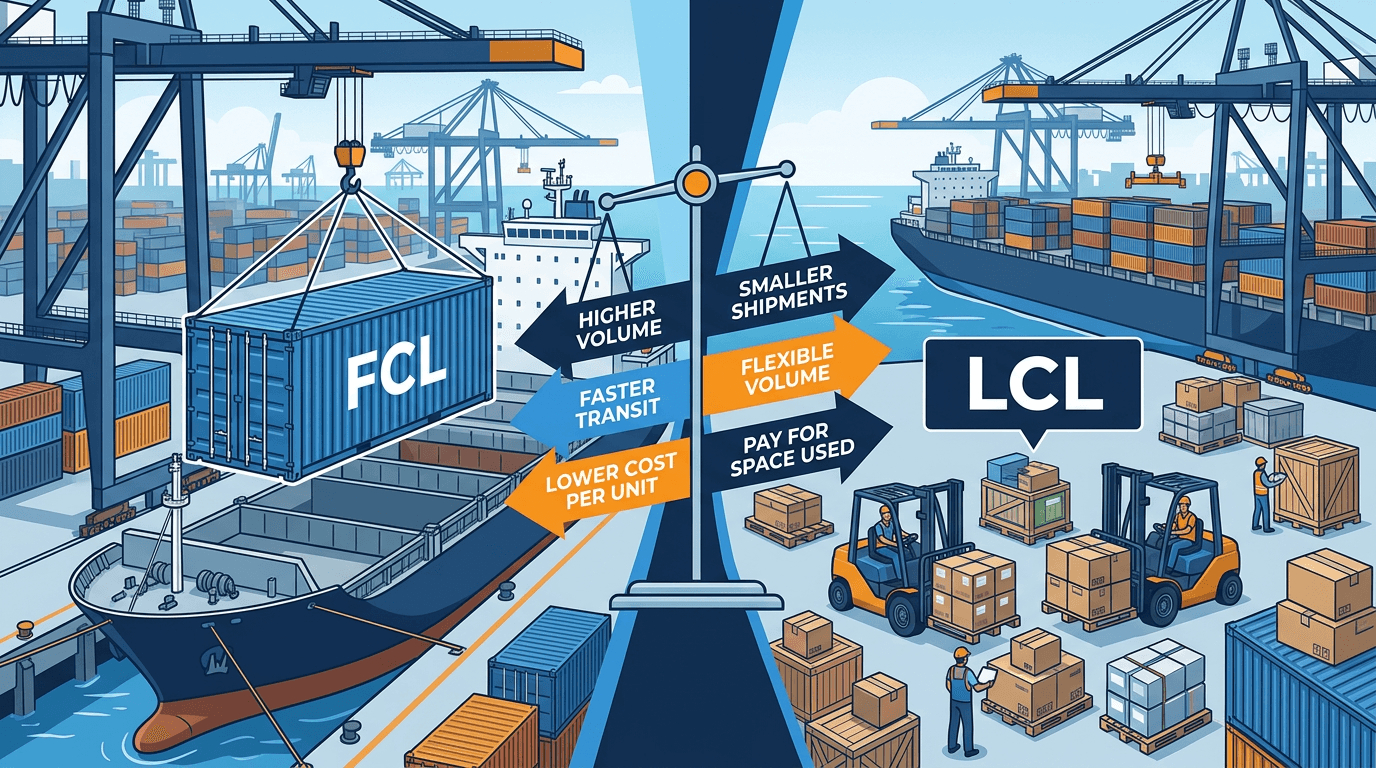
FCL vs LCL: The Calculation Most Teams Skip
Most operations teams still make this call on instinct.
Whatever the forwarder suggests. Whatever worked last time. Whatever feels right.
Then the invoice arrives and the margin isn't there.
The real question isn't "which mode is cheaper?"
It's: for this lane, at this volume, with this cargo profile — which one is actually cheaper?
Those are very different questions. Only one of them has a reliable answer.
The Problem Starts at the Quote
The number on a freight quote is rarely the number you pay.
A proper FCL total includes the ocean base rate, origin terminal handling, destination terminal and delivery charges, and any demurrage or detention exposure if turnaround is slow. On the LCL side, the variable per-CBM rate gets quoted prominently — but the real cost driver is usually the fixed layer underneath it: CFS receiving and release fees, documentation charges, and the operational drag that comes with a shared container.
Comparing headline quotes without this structure means comparing two different things. It's why LCL can look cheaper at booking and end up more expensive on the invoice. Not because anyone is hiding anything — but because the cost structure isn't visible until you build it out explicitly.
The Only Number That Actually Matters
Before choosing a mode, calculate the break-even CBM for that lane. Above this point, FCL typically wins. Below it, LCL usually does.
The formula is straightforward:
Break-Even CBM = (FCL All-In Cost − LCL Fixed Charges) / LCL Variable Rate per CBM
A concrete example:
FCL all-in cost is $1,620. LCL fixed charges (CFS + documentation) are $280. LCL variable rate is $96/CBM.
(1,620 − 280) / 96 = ~14 CBM
On this lane, shipments above 14 CBM favor FCL. Below that, LCL is the better bet — assuming no service constraints.
One important caveat: this threshold isn't static. CFS fees shift, destination practices change, and route congestion moves the economics. On active lanes, recalculate at least quarterly. In volatile markets, monthly is better.
Cost Is Only One Variable
Two modes with similar freight rates can produce very different business outcomes.
Cargo sensitivity. LCL shipments pass through consolidation and deconsolidation — extra touchpoints that increase handling exposure. For high-value or fragile goods, the risk premium on LCL can easily close a rate gap that looks comfortable on paper. If your historical claim rate on a product category is meaningful, that number belongs in the model.
Transit reliability. When stockouts are expensive or customer SLAs are tight, predictability matters as much as price. LCL transit time can look competitive in a quote, but actual performance depends heavily on consolidation quality and destination conditions. FCL's relative isolation from co-loading variability is worth something — and that something should be quantified, not assumed.
Cash flow structure. For teams with irregular order cadence or small-lot replenishment strategies, LCL's variable cost model has real value. Paying for used space beats paying for a half-empty container, even when FCL is nominally cheaper per CBM at higher volumes.
Folding these factors into a simple risk score — damage sensitivity, delay tolerance, predictability priority — turns a judgment call into a defensible, auditable decision.
Making the Decision Repeatable
A one-time calculation is useful. A system that produces consistent answers across planners and shipment cycles is what actually moves the needle.
The minimum viable setup:
Lane-specific cost templates. A fixed format that separates FCL and LCL cost components for each meaningful lane. Forwarder quotes get entered here — not compared as headline numbers.
Volume band scenarios. Pre-calculated outcomes at realistic shipment sizes: 4, 8, 12, 16, 24 CBM. Planners can make a fast call without running the full model every time.
Simple operating rules. Example: under 9 CBM default to LCL unless cargo is fragile or high-value; between 9 and 15 CBM run the break-even model; above 15 CBM default to FCL unless route constraints say otherwise. These rules create consistency and make decisions auditable.
Invoice reconciliation loop. After each shipment cycle, compare modeled versus actual cost. If variance is climbing, the template needs updating. This is where most teams drop the ball — and where the best ones pull ahead.
Teams that build this structure typically see measurable reductions in invoice variance and planning uncertainty within one to two billing cycles.
The Connection to Container Planning
Getting the mode decision right is only half the equation. If FCL is selected but loading quality is poor, the savings evaporate. Lower container utilization means higher freight cost per unit. Unbalanced loads increase damage risk. Poor sequencing creates warehouse friction that doesn't show up in the freight cost but absolutely shows up in total landed cost.
Treating mode selection and load planning as separate workflows produces inconsistent results. 3DLoadCalculator connects these two decisions — so once FCL is the right call, you can immediately model realistic loading scenarios, validate utilization, and produce execution-ready instructions for the warehouse team.
The Bottom Line
FCL vs LCL isn't a policy you set once and forget. Lane economics shift. Fee structures change. Cargo profiles evolve season to season.
Building a repeatable, data-driven decision framework — and feeding it with real invoice data — compounds into meaningful annual savings. The teams that treat mode selection as a living system, not a static rule, consistently outperform those that don't.
Start with one active lane. Build the template. Track one full billing cycle. Everything else scales from there.
See how 3DLoadCalculator fits into your container planning workflow →